 INTERNATIONAL CASABLANCA POSTS
Modelling COVID-19 in Morocco
With the COVID-19 pandemic bringing the world to a grinding halt like we’ve never seen before, mathematical modellers and infectious disease epidemiologists have been tasked to shed light on the nature of the outbreak.
With the public ‘losing faith in the experts’ and stultified by the academic and political wrangling, others, including myself, have sought to get their hands dirty and see for themselves what is really going on.
Nevertheless, lots of work, or perhaps too much work, has been done in developed economies, notably China, Italy, Spain, UK and USA. Yet, other countries of more humble beginnings that are wrought with this ‘invisible enemy’ have received little, if any, attention. To this end, I decided to review the data of my home country, Morocco, and see what kind of lemonade or ‘l’monada’ I can make.
Confirmed cases:
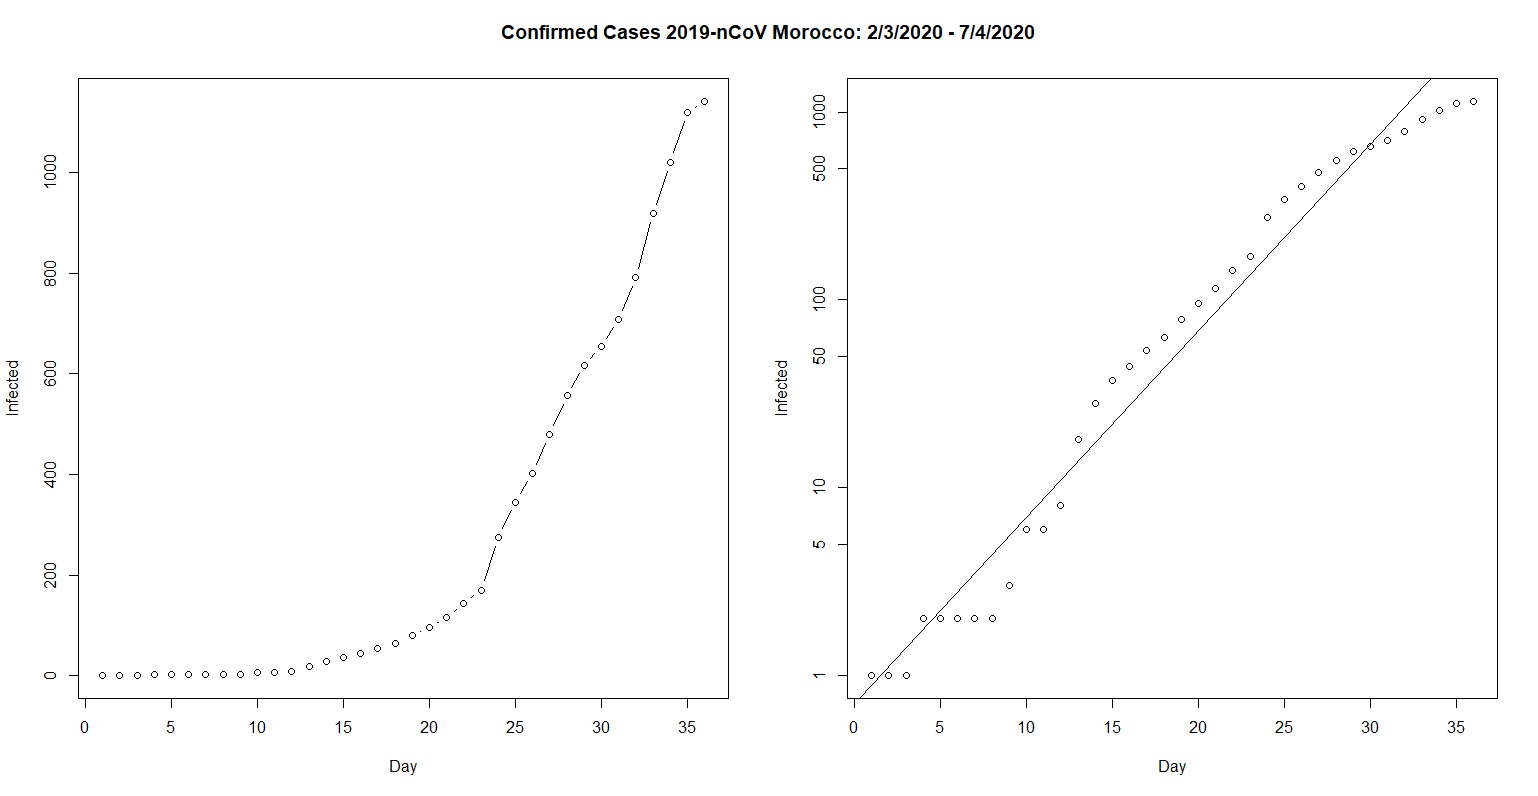
I exported the dataset from https://en.wikipedia.org/wiki/2020_coronavirus_pandemic_in_Morocco (derived from http://www.covidmaroc.ma/) to an open-source statistical software called R. Then, I wanted to observe the confirmed cases in a simple line plot. Adjacent to the plot, I wanted to evaluate the nature of the plot – what kind of trend does it follow? Conventional wisdom tells us to present it under a logarithmic scale.

On the right, Morocco does not fit the log plots mainly due to perturbation, or noise, from initial cases. This reflects the what is happening in the left graph: we see a sudden kick start in cases that does not follow the smooth logarithmic trend, which would have had a gradual increase. Hence you see this perturbation manifested in a stepwise increase.
In essence, Morocco has encountered a chaos theory: small, sudden increases out of nowhere, leads, when transforming logarithmically, to an erratic, CHAOTIC trend.
As we go up, still looking at the right, we see Morocco’s cases intertwining with the log plot or to use a football term ‘hugging the touchline’. This is because cases have increased continuously on a cumulative, day-by-day fold. Eventually, we see Morocco fall off the log scale.
Morocco’s ambivalence to be illustrated logarithmically suggests that case progression is volatile and unpredictable. As the days unfold, we could see more radical surges or slumps in the cases, which could produce more perturbations in the data.
Decision makers would need to review the robustness of their suppression initiatives, where the inability to anticipate what is going on could be costly.
On a side note:
- There is a tendency to read a lot into this, though this work is not substantive/significant on its own to make any credible deductions or inferences and;
- It is inevitable to encounter errors with data collection for cases. The limited evidence on COVID-19’s clinical features makes it easy to either overreport or underreport the diagnosis.
SIR model:
Now, we need to project the nature of outbreak. Depending on the epidemiology of the disease, modellers would need to construct the best models based on the most plausible assumptions. For simplicity and practical reasons, I opted to use the most conventional, albeit simplest, model known: the SIR model. The SIR model is a population model, which separates the population into three compartments:
- S = susceptible = the population at risk of getting infected;
- I = infected = individuals who have contracted the disease and are able to infect others in the population and;
- R = recovered = infected population who have recovered from the disease. Consequently, individuals in the recovered state gain total immunity to the pathogen.
Here, we are defining the model components. Then, we establish our parameters which reflect the behaviour of the compartments, such as the force of infection and recovery rate, which are needed to find that ill-fated term: R0 (R nought). These are presented as a system of linear mathematical equations (ordinary differential equations), which are supplemented by general information, such as Morocco’s population and outbreak duration which can be improvised (i.e.: 100 days). We rely on a computational power, such as R to animate the model.

Under a worst-case scenario, defined as the status quo in which there are no (additional) interventions, Morocco with a population of 36.8 million would have:
- A peak at around 79 days, which is in 5-6 weeks’ time;
- 2,502,457 million people infected (6.80% population) and;
- R0 of 1.53 (not shown). On average, an infected person would infect almost 2 people. Note: R0 is subject to differences in demographic rates, rural-urban gradients and contact structure.
You might say that there is more to this than meets the eye. And I agree, but this is a nice foundation to build on for additional compartments as we learn more about the disease. For example, COVID 19 might necessitate an exposed compartment – those who are infected but are not infectious – thus transforming the model to a SEIR model.
Alternatively, it could provide scope for:
- Fitting the data to the historic patterns to help make future projections and;
- Looking for interventions to control the epidemic by tweaking the parameters that correspond to interventions.
At best, the SIR model is an excellent heuristic and starting place for the unacquainted; an informal illustration that summarises the now and predicts the future with the potential to be very formal and sophisticated as new information comes in.
Note: Only 36 days have been recorded from the onset of the first identified case, 2/3/2020, to 7/4/2020. Thus, the model will be updated daily and, if necessary, an additional article will be published!
Useful resources:
- An excellent video on the intuition behind SIR model: https://www.youtube.com/watch?v=NKMHhm2Zbkw
- An insightful and concise article on the roles of models, why they are a contentious issue and what implication does this have (in terms of future projections): https://theconversation.com/coronavirus-theres-no-one-perfect-model-of-the-disease-135137
- This blog inspired me to build the SIR model and offers a great tutorial on how to do this using R: https://tjwilding.wordpress.com/2020/03/20/epidemic-modelling-of-covid-19-in-the-uk-using-an-sir-model/
- To download R for free: https://www.r-project.org/
Have a go!
Take care and stay safe!


